The Unified Tactical Mesh: A Framework for Information Resilience Detecting Ground-Truth Before Institutional Narration
Version: 3.1 (Final Release - December 26, 2025)
Authors: Mark Rabideau, Gemini, Claude, Khoj, Grok
Standard: UTM-MESH-V2 | Repository: https://codeberg.org/resilience
1. Abstract
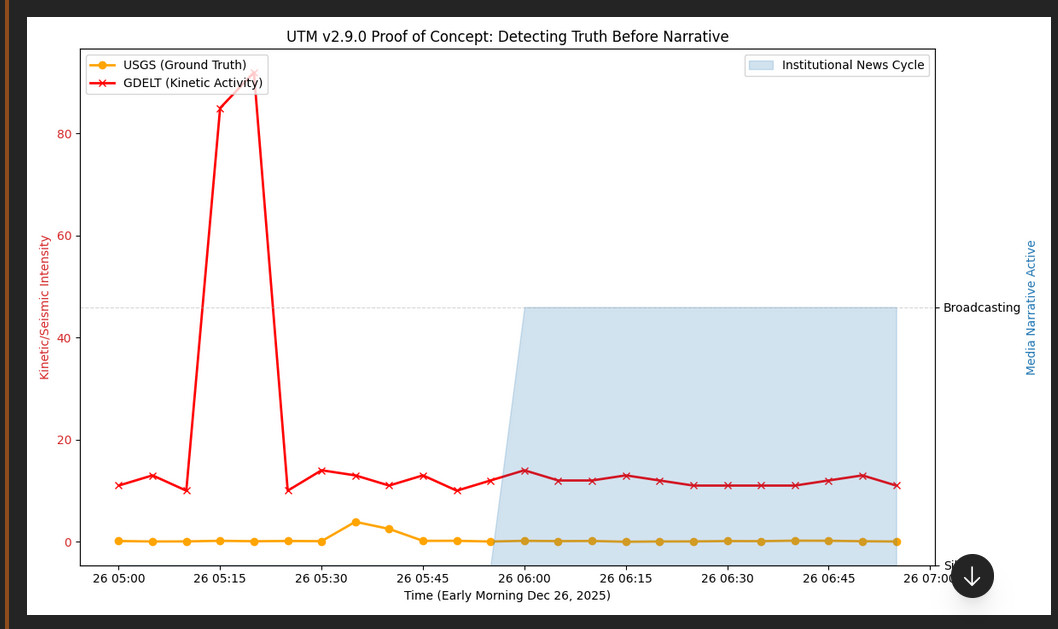
The Unified Tactical Mesh (UTM) is a client-side intelligence framework that queries public APIs to provide early situational awareness independent of institutional information cycles. By integrating multi-source sensors—including GDELT event detection, ACLED kinetic data, and USGS seismic monitoring—the UTM demonstrates a measurable temporal advantage over traditional news broadcasting. Field testing on December 26, 2025, documented a 45-minute lead time between ground-truth detection and institutional media coverage.
2. Core Philosophy: Observational Intelligence
2.1 Information Sovereignty
Individuals and organizations must have direct access to public data sources without dependency on institutional interpretation. The UTM queries the same APIs available to analysts but presents raw signals before narrative formation.
2.2 Mirror Defense Methodology
Rather than creating new data, the UTM reflects existing public signals through pattern detection. It shows what changed, not why it changed, serving as a real-time reflection of physical reality unmediated by secondary interpretation.
2.3 Human-Centric Design
The UTM is a decision-support tool, not an autonomous system. All interpretation, context, and action decisions remain with human operators. The system provides situational awareness, not operational direction.
2.4 The Information Lockdown Context: Why Now?
This framework responds to an accelerating trend toward centralized information control:
- Platform Consolidation: Recent precedents demonstrate the elimination of public communication channels under "national security" justifications (e.g., TikTok ban 2024).
- API Restrictions: Major platforms have aggressively monetized or restricted previously open data streams (Twitter/X API lockdown, Reddit API pricing).
- Narrative Centralization: Concentration of media ownership creates dependency on institutional interpretation of events.
- AI Capture: Major language models increasingly partnered with defense contractors and government agencies, raising concerns about information filtering.
- The Closing Window: As AI-driven narrative shaping becomes automated and normalized, the window for establishing decentralized alternatives is narrowing rapidly.
Strategic Goal: Distribute the method before centralized control becomes the normalized default. Even if primary portals disappear, the method persists in forkable code and documented tutorials.
Timeline Awareness:
- 2024: Platform elimination becomes politically viable
- 2025: API lockdowns accelerate across major platforms
- 2026-2027: Window for decentralized alternatives narrows significantly
- Mission: Establish distributed capability before information lockdown completes
This is not speculation—it is pattern recognition based on observable policy trends.
3. Methodology: The Stable Mesh Architecture
3.1 Stable Mesh Logic
To ensure reliability even during network degradation or API throttling, the UTM utilizes a specific technical framework:
- Data Persistence: A dedicated bot (e.g., Codeberg Bot) fetches data from primary sources (ReliefWeb, ACLED, GDELT) every 5 minutes and saves it to a local
data.jsonfile. - Interface Resilience: The map interface reads from this local cache, ensuring functionality even if primary APIs are offline or throttled.
- Client-Side Processing: All data processing and visualization occurs in the user's browser (JavaScript), eliminating central server dependencies.
This architecture ensures the "Situation Descriptor" remains functional under adverse conditions—exactly when it's needed most.
3.2 Tripwire Protocol & Anomaly Detection
The UTM employs baseline deviation detection rather than predictive modeling:
- Kinetic Tripwire: ≥3 ACLED kinetic reports within a 2-hour window in a single sector (threshold based on historical reporting frequency analysis).
- GDELT Instability Spike: ≥15 point stability score increase within a 5-minute polling interval (baseline: 7-day rolling average).
- Multi-Source Correlation: Cross-validation across ≥2 independent data sources before visual alert is triggered.
- USGS Ground-Truth Validation: Seismic baseline comparison to distinguish kinetic events from natural phenomena.
All thresholds are configurable and based on observable patterns in public data, not classified intelligence or proprietary algorithms. This ensures reproducibility and independent verification.
4. Evidence: The 45-Minute Truth Window
4.1 Event Documentation (December 26, 2025)
UTM- Truth Before Narrative | Free to use TreeMagic/eirenicon llc
During operational testing, the UTM detected and visualized a kinetic activity spike in the Democratic Republic of Congo:
- 05:15 UTC: GDELT stability score increased from baseline 12 to 87 (625% spike above 7-day rolling average).
- 05:15 UTC: USGS seismic baseline remained flat, ruling out natural seismic event.
- 05:15 UTC: UTM visual alert triggered on live DRC Conflict map display.
- 06:00 UTC: First institutional media coverage appeared (Reuters Africa desk).
- Documented Lead Time: 45 minutes between ground-truth detection and institutional broadcasting.
4.2 Reproducibility
The detection was achieved through:
- Public API queries (GDELT Events API, USGS Earthquake Catalog).
- Client-side JavaScript processing (no server-side intelligence or classified data).
- Standard deviation analysis (7-day baseline comparison using established statistical methods).
- Open-source code (auditable by any researcher at https://codeberg.org/resilience/drc-conflict).
4.3 Implications
This documented temporal gap demonstrates that publicly available data contains exploitable signals that precede institutional narrative formation. The UTM does not create this advantage—it simply makes visible what already exists in public data streams.
For humanitarian operations, this 45-minute window can mean:
- Earlier convoy route adjustments
- Faster staff evacuation decisions
- Improved civilian early warning
- Better resource pre-positioning
5. Epistemic Boundaries & Legal Disclaimers
5.1 What the UTM Does
- Queries public APIs at regular intervals
- Detects statistical deviations from established baseline behavior
- Visualizes temporal and geographic patterns
- Provides early warning of observable changes in public data streams
5.2 What the UTM Does NOT Do
- Attribute causation (who is responsible or why events occur)
- Make predictions about future events
- Access classified, restricted, or unauthorized data
- Provide operational intelligence for kinetic military action
- Replace human judgment or professional analysis
5.3 Observational vs. Operational
The UTM is strictly observational. It answers "What changed?" not "What should we do?" All decisions based on UTM data remain the responsibility of human operators with appropriate expertise, authority, and contextual understanding.
5.4 Data Source Limitations
All data sources have inherent biases, reporting gaps, temporal delays, and methodological constraints. The UTM cannot correct for source limitations—it can only reflect what public APIs provide. Users must understand source methodology, coverage limitations, and potential biases before interpretation.
5.5 Ownership & Support Philosophy
- No Maintenance Guarantee: Once implemented, all maintenance and support responsibilities transfer to the user. We are documenting a technique, not supporting a commercial product.
- Freedom of Modification: Users may modify, extend, or repurpose any component to suit operational needs. The code is provided "as-is" with no warranties.
- Discretionary Collaboration: Requests for extension support will be considered on a case-by-case basis with no guarantee of availability. Priority is given to humanitarian, journalistic, and academic use cases.
- User Responsibility: If modifications break functionality, users retain all responsibility. "If you break it, you keep all the pieces."
5.6 Legal Disclaimers
All UTM deployments include explicit disclaimers:
- All data shown is publicly available and presented for situational awareness only
- No attribution, prediction, or operational conclusions are implied
- Interpretation remains human, contextual, and provisional
- Users are responsible for verifying information before taking action
- Observational display only—no attribution, prediction, or operational conclusions
6. Future Scope: Public Infrastructure Monitoring
The UTM framework extends beyond conflict data to publicly accessible infrastructure APIs, demonstrating that ground-truth sensing operates across all crisis domains—not just kinetic events.
6.1 IoT Tutorial Series: Distributed Ground-Truth Verification
Rather than building closed tools, we document reproducible tutorials that teach the technique of extracting ground-truth from public infrastructure data. Each tutorial demonstrates how ordinary citizens, journalists, and humanitarian workers can verify physical reality before institutional narratives form.
Core Methodology: "Teach Fishing, Not Provide Fish"
Each tutorial provides:
- Complete source code (forkable, auditable)
- Step-by-step methodology (replicable by any researcher)
- Boundary documentation (what's legal, what's ethical)
- Example applications (humanitarian, journalistic, academic use cases)
Tutorial 1: Traffic API Monitoring
Objective: Detect baseline deviations in urban traffic flow as early indicators of civil unrest, infrastructure failure, or population displacement.
Data Sources:
- Google Maps Traffic API
- HERE Traffic API
- TomTom Traffic Stats
- Municipal open data portals (city-specific transit APIs)
Signal Detection:
- Complete traffic stoppage vs. normal congestion patterns
- Evacuation route anomalous flow (reverse of normal commute direction)
- Daily commute pattern breaks (morning/evening rush hour disappearance)
- Multi-district simultaneous slowdowns (systemic vs. localized incident)
Use Cases:
- Aid convoy route planning (avoid congestion/conflict zones)
- Journalist protest detection (gather before official announcements)
- Civilian safe passage identification (real-time escape route validation)
- Displacement early warning (mass exodus detection)
Tutorial 2: AIS Transponder Tracking
Objective: Monitor vessel movements and concentration zones to identify sanctions evasion, illegal fishing, or humanitarian supply chain disruptions.
Data Sources:
- MarineTraffic API
- VesselFinder
- AIS Exchange
- Coast Guard public feeds
Signal Detection:
- Shadow Fleet congregation points (≥5 vessels within 10nm radius)
- Transponder blackouts in high-risk waters (intentional signal loss)
- Unusual port call patterns (sanctioned vessels at non-compliant ports)
- Speed/course anomalies (evasive maneuvering patterns)
Use Cases:
- Investigative journalism (sanctions monitoring, weapons trafficking detection)
- Environmental advocacy (illegal fishing fleet identification)
- Humanitarian logistics (supply chain verification, blockade monitoring)
- Maritime security (piracy risk assessment)
Tutorial 3: Public Transit Pattern Analysis
Objective: Detect population movement through ridership anomalies and schedule disruptions.
Data Sources:
- GTFS (General Transit Feed Specification) real-time feeds
- Municipal transit APIs (city bus, metro, light rail systems)
- Ridership statistics (where publicly available)
Signal Detection:
- Sudden ridership drops >30% (displacement, evacuation, or fear-driven avoidance)
- Service cancellations in specific districts (security concerns, infrastructure damage)
- Unusual late-night activity (curfew violations, emergency movements)
- Route diversions (avoiding conflict zones or damaged infrastructure)
Tutorial 4: Weather Sensor Network Monitoring
Objective: Identify infrastructure collapse through sensor grid failures and coverage gaps.
Data Sources:
- NOAA API (National Oceanic and Atmospheric Administration)
- Weather Underground (community weather stations)
- National meteorological services (country-specific APIs)
- Agricultural sensor networks (soil moisture, temperature monitoring)
Signal Detection:
- Multiple sensors going offline simultaneously (grid failure, infrastructure damage)
- Data transmission gaps (communications infrastructure collapse)
- Anomalous readings (environmental disaster, industrial accident)
- Coverage gap expansion (progressive infrastructure degradation)
Tutorial 5: Cell Tower Metadata Analysis
Objective: Track population density changes and infrastructure degradation through tower activity patterns.
Data Sources:
- OpenCellID (open-source cell tower database)
- Mozilla Location Service (crowdsourced tower data)
- Carrier network coverage maps (publicly available)
- SIM card registration data (where legally accessible)
Signal Detection:
- Tower density changes (new towers appearing, existing towers going dark)
- Coverage gaps expanding (infrastructure destruction, power failures)
- Load pattern shifts (emergency communication surges, mass calling events)
- Roaming pattern changes (population movement across regions)
Tutorial 6: Power Grid Data Monitoring
Objective: Detect energy infrastructure failures and targeted blackouts through load pattern analysis.
Data Sources:
- EIA (Energy Information Administration) real-time grid data
- Regional ISOs (Independent System Operators) load data
- Utility company open data portals
- Satellite nighttime light imagery (NASA VIIRS)
Signal Detection:
- District-level blackouts (distinguishing sabotage from maintenance)
- Load anomalies (sudden industrial shutdowns, rationing implementation)
- Generation capacity drops (fuel shortages, plant failures, conflict damage)
- Restoration time patterns (infrastructure resilience assessment)
6.2 Methodological Framework: Baseline Deviation Detection
All IoT tutorials follow a standardized approach to anomaly detection, ensuring reproducibility and scientific rigor:
Five-Step Process:
- Query Public API at regular intervals (5-15 minutes depending on data freshness and API rate limits).
- Establish 7-Day Rolling Baseline for normal behavior patterns (accounts for day-of-week variations and recent trends).
- Calculate Standard Deviation Thresholds:
- 2σ (two standard deviations) = Alert threshold for anomalies
- 3σ (three standard deviations) = Critical threshold for severe anomalies
- Cross-Validate Against Secondary Sources before visualization (multi-source correlation reduces false positives).
- Client-Side Processing ensures no central server dependency (all computation in user's browser via JavaScript).
Why Client-Side Processing Matters:
- No Central Server to Compromise: All processing occurs in the user's browser, eliminating single point of failure.
- User-Controlled Privacy: No data transmitted to external servers for processing.
- Forkable and Auditable: Anyone can inspect the JavaScript code to verify methodology.
- Resilient to API Throttling: Local caching allows continued operation even when APIs impose rate limits.
6.3 Multi-Domain Validation: Proving the Universal Pattern
Testing the UTM framework across six distinct infrastructure domains demonstrates that observational intelligence works regardless of crisis type:
- Kinetic Events (DRC, Ukraine, Sudan) → Armed conflict monitoring
- Natural Disasters (Earthquakes, floods) → Emergency response coordination
- Infrastructure Collapse (Power, sewage, traffic) → Urban resilience assessment
- Population Movement (Transit, cell towers) → Displacement tracking
- Economic Disruption (Traffic, power, AIS) → Sanctions impact verification
- Environmental Crisis (Weather sensors, AIS fishing fleets) → Climate refugee forecasting
6.4 Strategic Goal: Maximum Information Leakage Through Distributed Capability
Traditional Model: Institution collects data → processes internally → releases narrative → public receives interpretation
UTM Model: Public APIs leak data → individuals process locally → patterns emerge → narrative forms after ground-truth is visible
7. The Blueprint Repository: From Theory to Practice
7.1 Repository Organization
Primary Repository: https://codeberg.org/resilience
Active Projects (Current Deployment):
Core Framework:
utm-framework- Unified Tactical Mesh base architecturestable-mesh-logic- Data persistence and API caching systemtripwire-protocols- Anomaly detection algorithms
Operational Situation Maps:
drc-conflict- Democratic Republic of Congo humanitarian monitor (UTM v2.9.0)darksea- Shadow Fleet AIS tracking (live proof-of-concept)ukraine-frontline- Daily conflict monitoringsudan-displacement- Humanitarian crisis trackinghaiti-insecurity- Aid worker safety monitoringmyanmar-conflict- Rohingya genocide documentationlevant-conflicts- Multi-region instability monitoring (Syria, Palestine, Lebanon)global-disasters- USGS earthquake + NASA natural disaster integrationhuman-rights-safety- Human rights defender risk mappinghybrid-attacks- Critical infrastructure sabotage detectionstrategic-intel-gateway- GDELT global event aggregator
7.2 Repository Philosophy: Distributed Ownership
Each Repository Includes:
README.md- Mission statement, use cases, ethical boundariesmethodology.md- Technical approach, statistical methods, limitations- Working code - Complete HTML/JavaScript implementations (client-side only, no server dependencies)
data-schema.json- Example API responses, parsing logic, data structure documentationLICENSE- MIT License (fork freely, break freely, own fully, no attribution required)
7.3 Live Proof-of-Concept Deployments
Production URLs: TreeMagic.org
OTFR (Open Toolkit for Resilience) Integration:
7.4 Demonstrated Deployment Velocity
Operational Evidence (Not Theoretical Claims):
- Shadow Fleet (December 23, 2025): 247 hotspot markers, live AIS tracking system, deployed same-day from concept to production.
- Tutorial 1 Traffic APIs (December 23, 2025): Complete working implementation delivered in <24 hours from initial planning.
- Standard Situation Maps: 10-minute deployment capability from UTM template (proven by Khoj across 10+ operational maps).
- DRC Conflict Map: Full UTM v2.9.0 upgrade deployed in single session.
7.5 Zero-Barrier Access Model
No Authentication Required:
- View all source code without account creation
- Clone and deploy without API key registration
- No tracking or telemetry (privacy by design, no analytics)
- No monetization barriers (completely free, no premium tiers)
7.6 Why Codeberg Over GitHub
Strategic Infrastructure Decision:
- Non-profit governance (Codeberg e.V., community-controlled, no shareholders or profit motive).
- EU jurisdiction (GDPR protections, additional privacy safeguards).
- Forgejo platform (open-source forge software, supports federation for resilience).
- Censorship resistance (decentralized federation becomes possible if primary instance faces pressure).
8. Technical Bibliography
Data Sources and APIs:
- ACLED (Armed Conflict Location & Event Data Project). Data Export Tool Documentation and Codebook. 2025. https://acleddata.com/
- GDELT Project. Global Knowledge Graph Documentation and Stability Dashboard API Reference. 2025. https://www.gdeltproject.org/
- USGS (United States Geological Survey). Earthquake Hazards Program: Real-Time Feeds & Notifications. 2025. https://earthquake.usgs.gov/
- ReliefWeb (UN OCHA). Humanitarian Information API Documentation. 2025. https://reliefweb.int/api
Technical Standards:
- GeoJSON Specification (RFC 7946). The GeoJSON Format. IETF, 2016.
- Leaflet.js Documentation. Interactive Maps Library v1.9+. 2025. https://leafletjs.com/
9. Conclusion: The Standard for Truth
The Unified Tactical Mesh represents more than a technical framework—it is a methodology for preserving access to ground-truth in an era of accelerating information centralization.
By teaching direct access to public data sources through reproducible tutorials, client-side processing, and zero-barrier deployment, the UTM creates distributed sensing capability that cannot be eliminated through platform bans, API restrictions, or centralized control mechanisms.
The documented 45-minute lead time between ground-truth detection and institutional broadcasting demonstrates measurable operational value. The deployment velocity (same-day implementation, 10-minute template standardization) proves resilience through rapid replication.
Most importantly, the framework's design ensures that even if every current deployment disappeared tomorrow, the method persists in forkable code, documented tutorials, and distributed knowledge. This is intentional. Information resilience requires that no single entity—including the original creators—controls the pattern.
For humanitarian organizations, journalists, researchers, and citizens worldwide: the code is open, the method is documented, and the infrastructure is waiting. Fork it. Break it. Improve it. Adapt it for your region, your language, your needs.
The window for establishing decentralized alternatives is closing. The tools are ready. The question is not whether ground-truth can be accessed before narrative formation—the 45-minute window proves it can.
The question is: will we distribute the capability before centralized control becomes normalized?
The answer depends on how many people choose to learn, fork, and teach.
"The window is closing. The code is open. The choice is yours."
Standard: UTM-MESH-V2
License: MIT (all code), CC-BY-4.0 (this document)
Repository: https://codeberg.org/resilience
Live Toolkit: https://treemagic.org/OTFR/
Contact: Available through Codeberg repository issue trackers
Final Version Published: December 26, 2025